In this template Rapporter will present you Multidimensional Scaling.
Multidimensional-scaling is a technique which gives us a visual representation about the distances between the observations.
Below you can see a plot, that presents you the distance between the observations, which was calculated based on Age, Internet usage for educational purposes (hours per day) and Internet usage in leisure time (hours per day).
84 differs the most from the others, and 8 seems to be the most "common" observation, which lie nearest to all other observations.
284 and 84 (8.02) are the "furthest", 280 and 1 (0) are the "nearest" to each other.
Now let's see which observations can be said statistically far/similar to each other in general. The 16 pairs with the biggest differences and the 10 pairs with the smallest differences will be presented. In the brackets you can see the amount of the distances between two observations.
There are 17 observations which are the most similar, and equal in the same time, that is a higher number than the wanted 16, thus will not be reported one-by-one. Set 17 as parameter max.dist.num to check the pairs if you are interested.
There are 318 observations which are the most similar and equal in the same time, that is a higher number than the wanted 10, thus will not be reported one-by-one. Set 318 as parameter min.dist.num to check the pairs if you are interested.
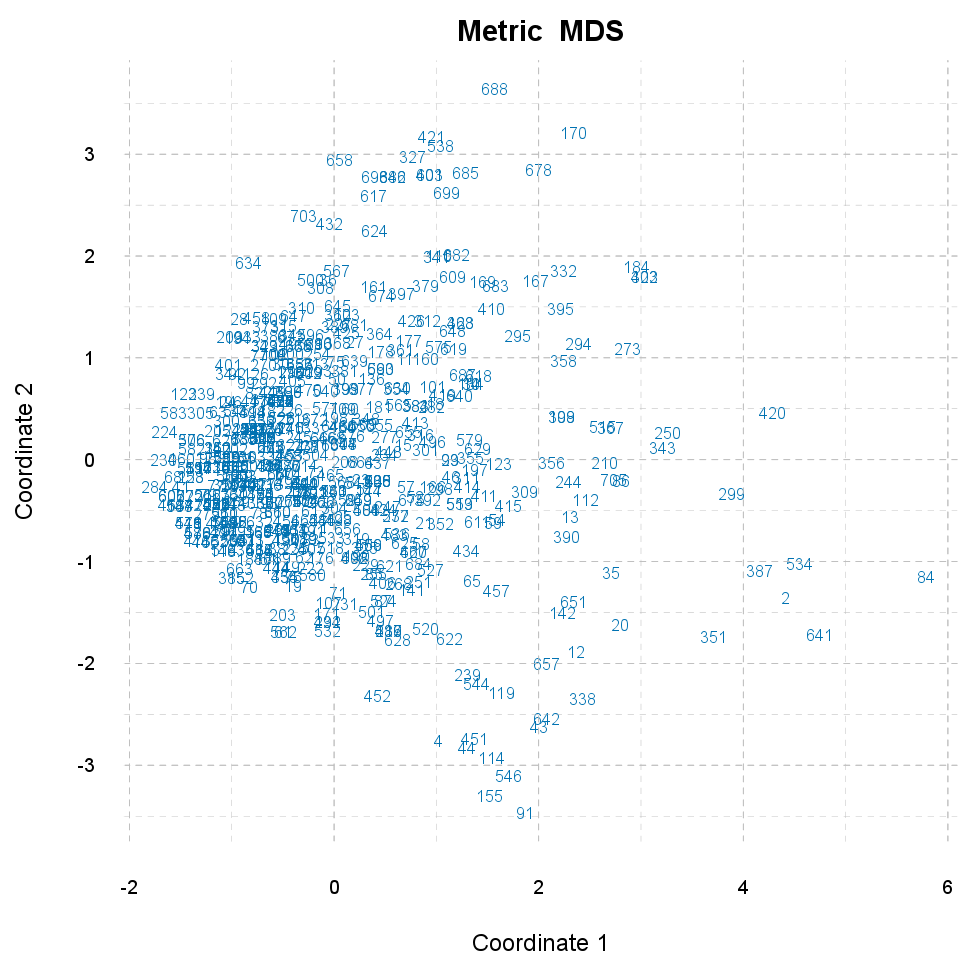
In this template Rapporter will present you Multidimensional Scaling.
Multidimensional-scaling is a technique which gives us a visual representation about the distances between the observations.
Below you can see a plot, that presents you the distance between the observations, which was calculated based on Age, Internet usage for educational purposes (hours per day) and Internet usage in leisure time (hours per day).
84 differs the most from the others, and 8 seems to be the most "common" observation, which lie nearest to all other observations.
284 and 84 (8.02) are the "furthest", 280 and 1 (0) are the "nearest" to each other.
Now let's see which observations can be said statistically far/similar to each other in general. The 17 pairs with the biggest differences and the 30 pairs with the smallest differences will be presented. In the brackets you can see the amount of the distances between two observations.
According to the used variables (Age, Internet usage for educational purposes (hours per day) and Internet usage in leisure time (hours per day)) the 17 furthest pair of observations are:
There are 318 observations which are the most similar and equal in the same time, that is a higher number than the wanted 30, thus will not be reported one-by-one. Set 318 as parameter min.dist.num to check the pairs if you are interested.
In this template Rapporter will present you Multidimensional Scaling.
Multidimensional-scaling is a technique which gives us a visual representation about the distances between the observations.
Below you can see a plot, that presents you the distance between the observations, which was calculated based on drat, cyl and mpg.
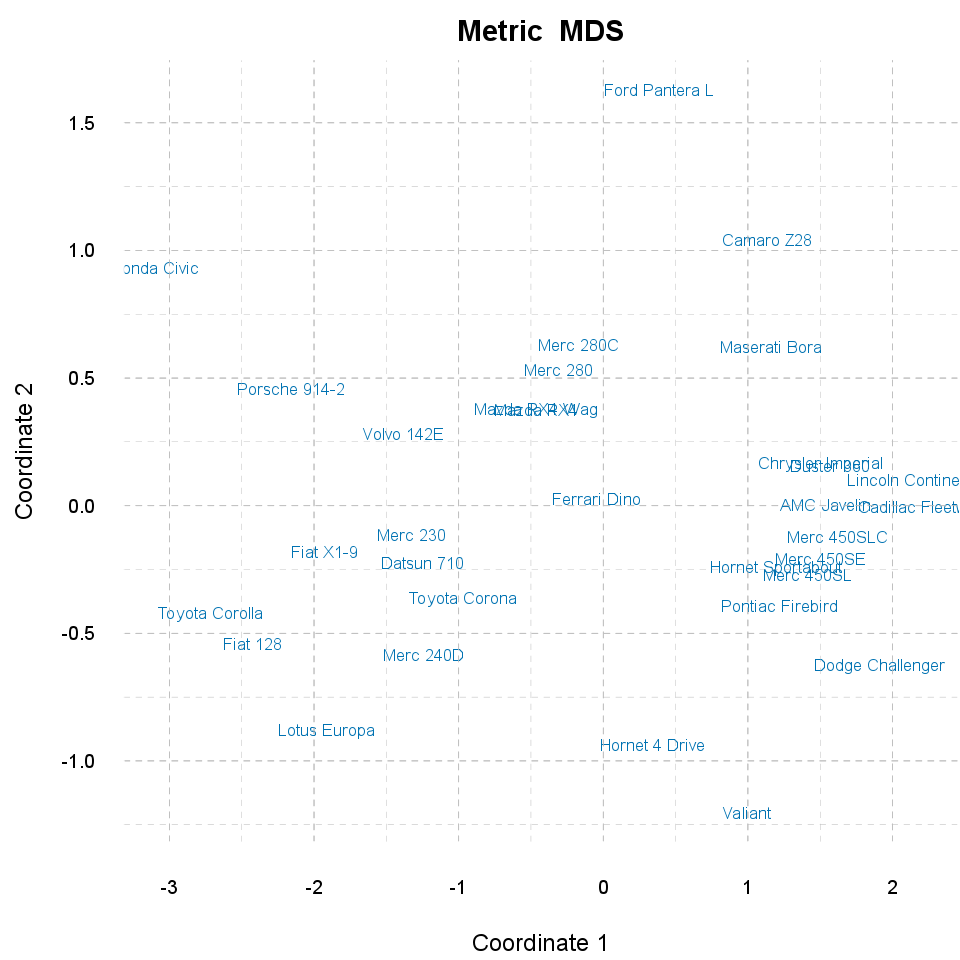
Honda Civic differs the most from the others, and Ferrari Dino seems to be the most "common" observation, which lie nearest to all other observations.
Honda Civic and Cadillac Fleetwood (5.48) are the "furthest", Mazda RX4 Wag and Mazda RX4 (0) are the "nearest" to each other.
Now let's see which observations can be said statistically far/similar to each other in general. The 17 pairs with the biggest differences and the 30 pairs with the smallest differences will be presented. In the brackets you can see the amount of the distances between two observations.
According to the used variables (drat, cyl and mpg) the 17 furthest pair of observations are:
According to the used variables (drat, cyl and mpg) the 30 nearest pair of observations are:
This report was generated with R (3.0.1) and rapport (0.51) in 3.338 sec on x86_64-unknown-linux-gnu platform.
Logo and design: © 2012 rapport Development Team | License (AGPL3) | Fork on GitHub | Styled with skeleton