In this template Rapporter will present you Principal Component Analysis.
Principal Component Analysis is a dimension reduction method. It produces linearly independent principal components using the variances of the observations in a set of variables.
| PC1 | PC2 | PC3 | |
|---|---|---|---|
| Standard deviation | 6.298 | 1.35 | 0.9088 |
| Proportion of Variance | 0.9354 | 0.04298 | 0.01947 |
| Cumulative Proportion | 0.9354 | 0.9783 | 0.9978 |
From the table above one can see that the first 3 Principal Components contains the 93.535 %, 4.298 % and 1.947 % of the variances, so together the 99.78 % of that.
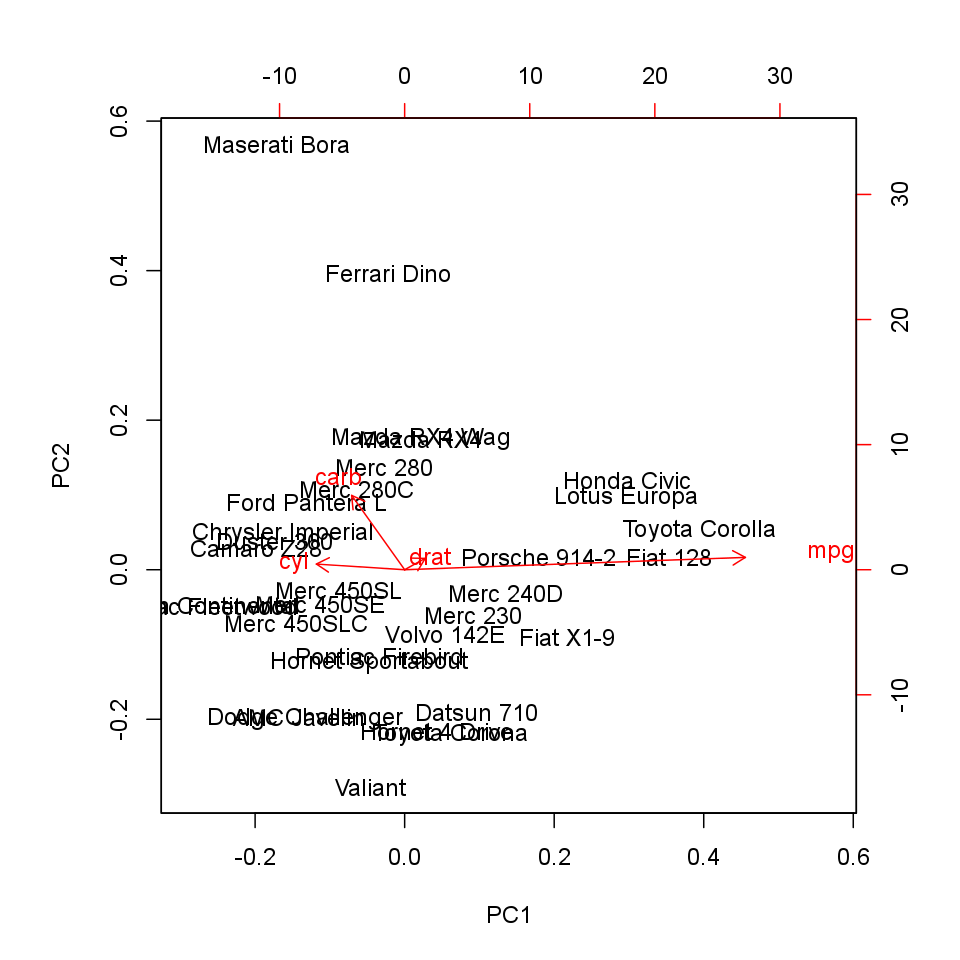
It could be informative to see visually how the observations lies on these components. On that two dimensional plot below, where the axes are the components which contains the two most variances, you can see (the red vectors) the effect of the variables as well.
As you wanted to check the Rotation matrix let us present that for you:
| PC1 | PC2 | PC3 | |
|---|---|---|---|
| carb | -0.1486 | 0.9728 | -0.08587 |
| mpg | 0.9557 | 0.1614 | 0.2433 |
| cyl | -0.2476 | 0.07389 | 0.9502 |
| drat | 0.05777 | 0.1488 | -0.1745 |
The cells written in bold shows which components explain the most variances of the variables, with the help of them we can draw the following conclusion:
We can say that none of these impacts are negative.
In this template Rapporter will present you Principal Component Analysis.
Principal Component Analysis is a dimension reduction method. It produces linearly independent principal components using the variances of the observations in a set of variables.
| PC1 | PC2 | PC3 | |
|---|---|---|---|
| Standard deviation | 6.298 | 1.35 | 0.9088 |
| Proportion of Variance | 0.9354 | 0.04298 | 0.01947 |
| Cumulative Proportion | 0.9354 | 0.9783 | 0.9978 |
From the table above one can see that the first 3 Principal Components contains the 93.535 %, 4.298 % and 1.947 % of the variances, so together the 99.78 % of that.
It could be informative to see visually how the observations lies on these components. On that two dimensional plot below, where the axes are the components which contains the two most variances, you can see (the red vectors) the effect of the variables as well.
As you wanted to check the Rotation matrix let us present that for you:
| PC1 | PC2 | PC3 | |
|---|---|---|---|
| carb | -0.1486 | 0.9728 | -0.08587 |
| mpg | 0.9557 | 0.1614 | 0.2433 |
| cyl | -0.2476 | 0.07389 | 0.9502 |
| drat | 0.05777 | 0.1488 | -0.1745 |
The cells written in bold shows which components explain the most variances of the variables, with the help of them we can draw the following conclusion:
We can say that none of these impacts are negative.
This report was generated with R (3.0.1) and rapport (0.51) in 0.891 sec on x86_64-unknown-linux-gnu platform.
Logo and design: © 2012 rapport Development Team | License (AGPL3) | Fork on GitHub | Styled with skeleton